
What is a Good ROAS? Benchmarks for eCommerce Brands (2026)

Recent 2026 ecommerce benchmark data puts average ROAS at around 2.87x, with a median of 2.04x. However, benchmarks vary by platform, industry, attribution method, and dataset, so use these figures as reference points rather than fixed targets.
A good ROAS stays above your break-even ROAS and leaves enough profit after covering product, fulfillment, and advertising costs.
What is ROAS and How Do You Measure It?

Return on ad spend (ROAS) shows how much revenue your store generates for every dollar spent on paid advertising.
It helps you justify whether your ads are generating enough sales for your spend.
To calculate the ROAS, use this standard formula:
ROAS = Gross Revenue From Ads/Total Ad Spend
Example: If your brand spends $10,000 on Meta or Google Ads and generates $30,000 in revenue from those ads, your ROAS is 3.0x.
That means you generated $3 in revenue for every $1 spent on advertising.
What are the E-commerce ROAS 2026 Benchmarks by Industry?
E-commerce ROAS benchmarks in 2026 vary by industry and platform. Google Ads has a higher cross-industry median of 3.27x and 3.68x, partly because it reaches people who are already searching for products or solutions. Meta Ads has a lower median of 1.86x and 2.19x, as it often reaches people while they are browsing social media rather than actively looking to buy.
Here are the reported 2026 category-specific medians across the two major ad channels:
| Product Vertical | Google Ads Median ROAS | Meta Ads Median ROAS | Primary Channel Strength |
| Apparel & Fashion | 4.07x–4.80x | 2.65x–2.90x | Google Ads |
| Automotive Parts & Vehicles | 3.60x–5.44x | 2.40x–6.76x | Meta Ads |
| Baby Care & Products | 3.80x–6.09x | 2.49x–4.39x | Balanced |
| Beauty & Personal Care | 3.07x–6.10x | 1.57x–3.20x | Google Shopping |
| Food & Beverage | 3.20x | 1.69x | Google Ads |
| Furniture & Home Decor | 3.87x | 4.67x | Meta Ads |
| Home Improvement | 4.07x | 3.94x | Both |
| Kitchenware | 4.81x | 3.28x | Google Ads |
| Healthcare & Life Sciences | 2.09x–5.00x | 1.19x–3.50x | Google Ads |
| Pet Care & Products | 2.55x | 1.69x–4.10x | Google Ads |
These benchmarks show one thing: your ROAS depends on how much you pay to acquire each customer on different platforms.
Why Can’t You Rely Only on Industry Benchmarks?
One common mistake in ecommerce is setting your ROAS target based only on an industry average.
For example, if a report shows a 3.0x average ROAS for your category, you might set 3.0x as your target. But that number does not account for your own costs.
Your product costs, fulfillment, shipping, storage, payment fees, and other expenses all affect how much profit you make from each sale. Always evaluate ROAS alongside your profit margin.
That is why you need to know your financial floor first: the minimum return on ad spend you need to cover your costs without losing money. In ecommerce, this is your break-even ROAS.
Once you know your break-even ROAS, you can use industry benchmarks to put your ad performance into context rather than treating it as a fixed target.
What is a Break-Even ROAS and Why Does it Matter?

Your break-even ROAS is the minimum return your ads need to generate for you to cover your costs. At this point, you are not making a profit, but you are not losing money either.
If your ROAS falls below this number, your advertising is not generating enough revenue to cover the costs associated with those sales.
To calculate your break-even ROAS, first determine your gross profit margin.
Subtract your costs from your average order value (AOV), then divide the result by your AOV.
The formula is:
Break-Even ROAS = 1/Gross Profit Margin %
What this means: The higher your profit margin, the lower your break-even ROAS.
For example:
- Cosmetics brand: If your gross profit margin is 80%, your break-even ROAS is 1.25x ($1 ÷ 0.80). A higher margin gives you more room to spend on advertising.
- Electronics brand: If your gross profit margin is 20%, your break-even ROAS is 5.00x ($1 ÷ 0.20). A 4.0x ROAS may look strong compared with an industry benchmark, but it would still be below this brand’s break-even point.
How Do You Know If Your ROAS Is Good?
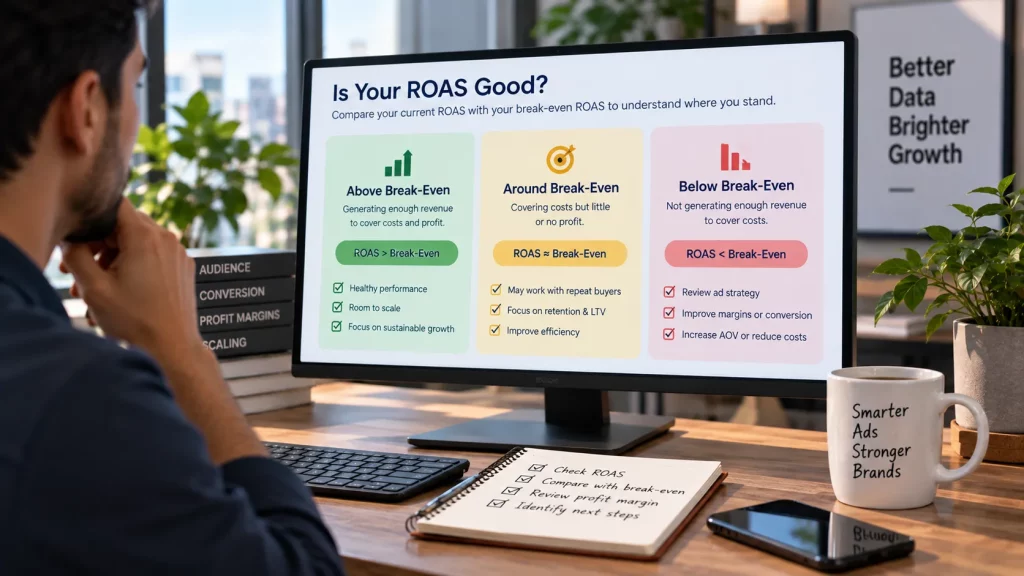
Compare your current return on ad spend with your break-even ROAS. This gives you a more useful view of your ad performance than an industry average alone.
Your results generally fall into three situations:
1. ROAS Is Comfortably Above Break-Even
The situation: Your ROAS is above your break-even point.
What it means: Your ads are generating enough revenue to cover the costs of the products and advertising while leaving room for profit.
If your wider business numbers also support it, this may give you room to increase your advertising spend. But before increasing spend, first understand what happens to ROAS as you scale your campaigns.
2. ROAS Is Around Break-Even
The situation: Your ROAS is close to your break-even point.
What it means: Your first purchase may generate little or no profit after advertising and product costs.
This can still make sense for businesses with strong repeat purchases and customer retention. The first sale may help you acquire a customer who goes on to make additional purchases later.
However, you need to account for customer retention and future purchase value before treating break-even acquisition as a growth strategy.
3. ROAS Is Below Break-Even
The situation: Your ROAS is below your break-even point.
What it means: Your advertising is not generating enough revenue to cover the costs tied to those sales.
An industry benchmark does not change this. For example, if the average ROAS in your category is 1.90x but your break-even point is 2.50x, a 1.90x ROAS still leaves you below your own cost threshold.
Possible ways to improve the numbers include increasing your conversion rate, improving margins, raising prices where appropriate, or increasing AOV through bundles and cross-sells.
One Action to Take Today
Instead of setting your ROAS target from an industry average, calculate your own break-even ROAS first.
Map out your product costs, fulfillment costs, fees, and advertising spend to understand the minimum return you need.
Then use industry benchmarks to compare your performance across platforms and categories. Your own margins should ultimately guide your ROAS target and advertising budget.
FAQs
What is a good ROAS for ecommerce in 2026?
The cross-industry median ROAS for US ecommerce stores ranges between 2.04x and 2.87x. However, a good ROAS depends on your business costs and profit margins. Your target should be above your break-even ROAS if you want to generate profit from the first purchase.
Why is Google Ads ROAS generally higher than Meta Ads?
Google Ads often reaches people who are already searching for a product or solution, while Meta Ads can reach people who are browsing social media without an immediate buying intent.
Can a store be profitable with a low ROAS?
Yes. It depends on the store’s profit margin and other costs. For example, a business with an 80% gross profit margin has a break-even ROAS of 1.25x. A 1.5x ROAS would therefore be above its break-even point.
What happens if my ROAS is below break-even?
If your ROAS is below your break-even point, your advertising is not generating enough revenue to cover the costs associated with those sales.
Depending on the cause, you may need to improve conversion rates, increase AOV through bundles or cross-sells, improve product margins, adjust pricing, or reduce operating costs.
Does ROAS change when you scale ad spend?
Yes. ROAS can decrease as you increase ad spend because campaigns may reach less qualified or less responsive audiences. A ROAS target should therefore account for how performance changes at different spending levels, rather than relying on a single benchmark.
Should I use the same ROAS target for Google Ads and Meta Ads?
Not necessarily. Google Ads and Meta Ads can have different costs, audience intent, conversion rates, and attribution patterns. It is often more useful to evaluate each channel against its own performance and your overall profitability rather than applying one ROAS target across both platforms.
Is a higher ROAS always better for an ecommerce business?
No. A higher ROAS does not automatically mean higher overall profit or growth. A campaign can have a strong ROAS but generate limited revenue because spending is too low, while a lower ROAS campaign may contribute more total profit at scale. Evaluate ROAS alongside profit margins, revenue, customer value, and total advertising spend.