27 YouTube Studio Advanced Analytics You Must Always Track

YouTube Studio turns raw viewing behavior into signals you can act on. Most creators glance at totals and miss the patterns that actually drive growth. This guide shows you how to read YouTube Studio Analytics like an analyst and an editor — mapping symptoms to the right report, using Key Moments to plan specific edits, segmenting data in Advanced Mode before making any changes, and running a simple two-week optimization loop that improves results without guesswork.

What Is YouTube Studio Analytics?
YouTube Studio Analytics is the built-in reporting dashboard inside YouTube Studio. It shows how viewers discover your content, how long they watch, who returns, and how different formats perform. It is available free to every YouTube channel and is the most reliable source of first-party performance data available to creators.
- Path: YouTube Studio → Analytics
- Tabs: Overview, Reach, Engagement, Audience, Research
- Format Filter: All Content, Videos, Shorts, Live
- Advanced Mode: Analytics → Advanced Mode for comparisons, dimensions, and exports
Use the tabs for fast context and Advanced Mode for all real decisions.
Overview Tab: Read Channel Health Before You Diagnose
Path: Analytics → Overview. The Overview tab is your health check. Confirm direction here, then open the specific report that explains why.
1. Views
Total plays in the selected period. Best used to compare scale against similar videos and time ranges — not as a standalone success metric.
2. Watch Time
Total time viewers spent watching. A core algorithm signal that rises when retention strengthens or more sessions occur. YouTube weights this heavily in recommendations.
3. Average View Duration
Average time watched per view. A direct read on pacing and structure. Pair this with Audience Retention when making edit decisions.
4. Subscribers
Net subscribers gained or lost in the period. A loyalty indicator that should align with your topic and packaging — it will slip even as views rise if those two things are misaligned.
5. Estimated Revenue (Monetized Channels)
Estimated earnings from ads and channel features. Useful for business context. For deeper monetization analysis, open the Revenue tab where you can review CPM, RPM, and which videos generate the most income.
Reach Tab: Measure Distribution and Click Decision
Path: Analytics → Reach. Reach explains how often YouTube shows your thumbnail and how often viewers choose to click it.
6. Impressions
The number of times your thumbnail appeared on eligible surfaces. Tells you how much distribution you are receiving before viewers make a choice.
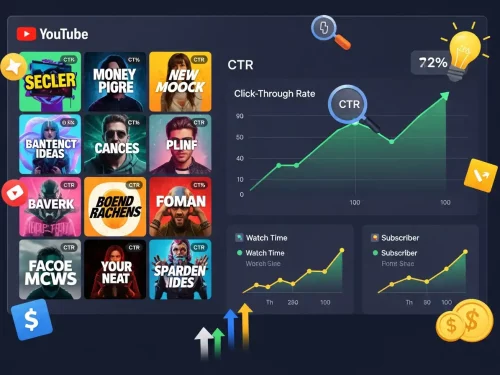
7. Impressions Click-Through Rate (CTR)
The percentage of impressions that converted into views. A measure of packaging fit on surfaces where your thumbnail appeared. A healthy CTR typically falls between 4–6%. Strong performers reach 7–10%, and niche channels with loyal audiences can exceed 10%. Below 3% is a clear signal to rework your title or thumbnail.
8. Views and Unique Viewers
Total plays and estimated distinct viewers viewed together. Judges both reach scale and the true size of your audience in a given period.
9. Traffic Source Types
The breakdown of discovery across YouTube Search, Suggested Videos, Browse Features, External, and Channel Pages. Use this to match titles, thumbnails, and sequencing strategy to the winning source. Drill into the YouTube Search source to see the actual search queries driving impressions — this is one of the most valuable keyword discovery features inside Studio.
Engagement Tab: Improve Watch Time and Retention
Path: Analytics → Engagement. Engagement shows what viewers do after they click — and where they leave.
10. Watch Time
Total time watched for the selected period. The primary signal that your content holds attention and deepens viewing sessions.
11. Average View Duration
Average minutes or seconds watched per view. A clear pacing signal. When low, it points to a slow opening, a weak hook, or a structural problem in the first third of your video.
12. Average Percentage Viewed
The average portion of the video watched across all views. A length-adjusted completion read that helps you pick target durations for future uploads.
13. Audience Retention
A moment-by-moment curve of remaining viewers. Highlights cut points, re-hook opportunities, and stable zones where Cards can safely be placed without interrupting engaged viewers.
14. Key Moments for Audience Retention
A set of highlighted timestamps — including Intro, Top Moments, Spikes, and Dips — that translate directly into edit decisions. Move the value claim forward if the intro drops steeply. Trim off-topic segments at dip points. Reinforce high-retention moments with Cards.
15. Cards and End Screens
Interactive elements that push viewers toward their next view. Place these on stable retention zones only — never on dip points — to protect session depth and increase Views Per Unique Viewer.
Audience Tab: Grow Returning Viewers and Program Upload Timing
Path: Analytics → Audience. Audience tells you who watches, who comes back, and when they are most active.
16. Returning Viewers
People who came back in the selected period. The main loyalty signal you grow with series formats and consistent upload slots. Rising returning viewers means your content is building a habit.
17. New Viewers and Unique Viewers
First-time and estimated distinct viewers. Defines top-of-funnel size and the potential pool for converting casual viewers into loyal returners.
18. Watch Time From Subscribers
The split of watch time between subscribers and non-subscribers. A fit check for your core audience. This number should rise on series uploads — if it stays flat, your subscribers are not engaging with the content you are making for them.
19. When Your Viewers Are on YouTube
A heatmap of active hours and days. Use this to guide upload timing and Community Post scheduling. Post inside high-density blocks — not at arbitrary times — to maximize early session velocity, which influences how broadly YouTube distributes a new upload.
20. Top Geographies, Age, and Gender
Location and demographic context for captions, language choices, cultural cues, and timing decisions. If a large geography segment is consuming your content, consider whether your thumbnails and titles are visually accessible in that market.
21. Other Channels and Videos Your Audience Watches
External viewing patterns that reveal topics, formats, lengths, and packaging styles your audience already prefers. This is your competitive intelligence for content planning — use it before you finalize your next series topic.
Must Read: Top 14 Metrics You Should Track in YouTube Analytics
Research Tab: Find What Your Audience Is Searching For
Path: Analytics → Research. The Research tab (previously Content Gap Insights) is one of the most underused features in YouTube Studio. It shows what your audience is actively searching for and highlights content gaps — topics with real search demand where strong videos do not yet exist.
- Search Volume Trends: See which queries are rising or falling in your niche over time.
- Your Audience’s Searches: Queries typed by people who already watch your channel — direct input for content planning.
- Content Gaps: Topics with consistent search demand but few strong videos covering them — your highest-opportunity publish targets.
Use the Research tab before finalizing any new video topic. If a query shows a content gap, you have a data-backed case to prioritize that video. If it shows high competition, you need a differentiated angle to compete.
Format Analytics: Videos, Shorts, and Live
Path: Analytics → Content → filter by Videos, Shorts, or Live. Formats operate under different algorithm rules. Never compare them in the same read.
22. Videos
Evaluate Average View Duration, Average Percentage Viewed, and the Audience Retention curve together. These three together will tell you where to cut, where to add a re-hook, and whether your current target length is working for your audience.
23. Shorts
Shorts operate on a separate algorithm that prioritizes completion rate above all other signals. Read Engaged Views and check where early drop-off happens — most losses occur in the first one to two seconds. Optimize on-screen text for instant clarity and test your opening frame as a static image to see if it communicates the value before motion begins.
24. Live
Monitor Concurrent Viewers and Chat Rate during stream to gauge real-time engagement. After streaming, repackage the replay as video-on-demand with a fresh intro, clean chapters, and a strong thumbnail — live replays without these elements significantly underperform edited uploads of the same content.
Advanced Mode: Trend, Segment, and Compare
Path: Analytics → Advanced Mode. Advanced Mode is where decisions happen. Never make a content or packaging change based on top-line numbers alone — segment first.
25. Secondary Dimensions
Use Traffic Source, Geography, Device Type, Subscription Status, and Content Type to break down performance before acting. A video that looks weak overall may be performing well from Browse and poorly from Search — two completely different fixes.
26. Key Comparisons to Run Regularly
- Average View Duration by Traffic Source — reveals where your packaging is working and where it needs adjustment.
- Average Percentage Viewed by Video Length Cohort — data-driven guidance on which target duration best serves your audience.
- Views Per Unique Viewer — rising values signal replay value. Identify the content pattern behind it and repeat it.
27. Saved Exports
Maintain a consistent CSV export template and save your Advanced Mode views so every team member reads and reports from the same data structure each week.
Open the Right Report for the Right Question
Start with a question and go directly to the one report that answers it.
| Question | Report to Open | Exact Path | What to Look For | Decision Trigger |
|---|---|---|---|---|
| Why did views stall after day three? | Impressions and CTR by source | Analytics → Reach → Traffic Source Types | CTR trend by source over last seven days | Repackage title and thumbnail for the weak source |
| Why are people leaving at minute one? | Audience Retention and Key Moments | Analytics → Engagement → Audience Retention | Intro steepness and first plateau timing | Reshoot or re-edit the first 30 seconds |
| Which source produces the best watch time? | Average View Duration by Traffic Source | Analytics → Advanced Mode → Secondary Dimension: Traffic Source | AVD ranked by source | Build End Screens and playlists that feed the winning source |
| Did subscribers actually watch this upload? | Watch Time From Subscribers | Analytics → Audience | Watch time split: subscribers vs. non-subscribers | Plan a follow-up that speaks directly to core subscribers |
| Is video length hurting completion? | Average Percentage Viewed by length cohort | Analytics → Advanced Mode with saved groups | Completion rate ranked by duration cohort | Adjust target length for the series |
| What topics should my next video cover? | Research Tab | Analytics → Research | Content gaps and rising search queries from your audience | Prioritize gap topics with rising demand for your next publish |
Audience Development: Levers You Can Pull This Week
- When Your Viewers Are on YouTube: Post uploads inside high-density viewing blocks. Early velocity signals drive broader distribution.
- Watch Time From Subscribers: If low, schedule your next video specifically for your core subscriber base — a series continuation or a topic they have explicitly searched for.
- Views Per Unique Viewer: Rising values signal strong replay value. Identify the content pattern or format driving it and build your next series around it.
- Series Format and Upload Timing: Pick a consistent day and time slot. Give viewers a habit to follow — unpredictable schedules suppress returning viewer rates.
Two-Week Optimization Plan for Any Upload
Small scheduled changes beat big reactive edits. Run this plan on any single upload to systematically improve its performance without guessing.
- Day 0–1: Check the Realtime card, early CTR, and the first Audience Retention read. Establish your baseline before touching anything.
- Day 2–3: If CTR is weak, test a clearer title and thumbnail. Change only the packaging — keep video content identical so you know what moved the needle.
- Day 4–7: If Average View Duration is weak, trim slow segments and add a mid-video re-hook at the first major dip point from the Key Moments report.
- Day 8–10: Strengthen session pathways. Add one targeted Card and sharpen your End Screen to point clearly to the next most relevant video.
- Day 11–14: Publish a related sequel or a Community Post that sends viewers back to the original video and its playlist.
Saved Reports to Set Up in Advanced Mode
- Traffic Source Comparison View: Average View Duration and CTR broken down by Traffic Source — your weekly packaging health check.
- Series Performance View: A saved group of related videos showing Average Percentage Viewed and End Screen click rate side by side.
- Weekly Export Template: One consistent CSV format that feeds your reporting dashboard without manual cleanup every week.
YouTube Studio Analytics vs Third-Party Tools
YouTube Studio is the starting point — but it has known limitations. It only shows your own channel data, has minimal keyword research capability, and provides no competitor intelligence. Understanding where it ends helps you know when to reach for additional tools.
| Feature | YouTube Studio | VidIQ | TubeBuddy |
|---|---|---|---|
| First-party channel data | ✓ Most accurate | Estimated | Estimated |
| YouTube keyword search volume | ✗ | ✓ | ✓ |
| Competitor channel analytics | ✗ | ✓ | ✓ |
| Thumbnail A/B testing | ✓ Native (test & compare) | ✗ | ✓ |
| Content gap discovery | ✓ Research tab | ✓ | ✓ |
| Cost | Free | From $7.50/mo | From $4.99/mo |
Common Analysis Mistakes That Break Results
- Comparing Shorts with long-form videos or mixing formats in a single read — each format has a different algorithm and different success benchmarks.
- Changing title, thumbnail, and video content simultaneously — you will not know what moved the needle.
- Skipping segmentation in Advanced Mode and treating one aggregate number as the full story.
- Reacting to data inside the first 24 hours before trends have had time to stabilize.
- Ignoring the Research tab and planning content from assumptions rather than actual audience search behavior.
Frequently Asked Questions
What is a good CTR on YouTube?
A healthy CTR falls between 4–6% for most content types. How-to and tutorial content typically lands in that range. Entertainment content can reach 6–10%. Channels with loyal niche audiences sometimes see CTR above 10%. Below 3% is a signal to test a new thumbnail or rewrite the title.
How do I find my Audience Retention in YouTube Studio?
Go to Analytics → Engagement → Audience Retention. Select the video you want to analyze. The curve shows the percentage of viewers still watching at every second of the video. Use the Key Moments section below the curve to see which timestamps YouTube has flagged as Intro, Top Moments, Spikes, and Dips.
What is Impressions Click-Through Rate on YouTube?
Impressions CTR is the percentage of times someone saw your thumbnail and chose to click it. It measures packaging effectiveness — not content quality. A low CTR means your title or thumbnail is not compelling enough on the surface where it appeared. You can see CTR broken down by traffic source in the Reach tab.
What does Average View Duration mean on YouTube?
Average View Duration is the average number of minutes or seconds viewers watched per view. It reflects how well your content holds attention. A low AVD relative to your video length usually indicates a slow opening, a weak hook in the first 30 seconds, or an off-topic segment creating a drop-off at a specific timestamp.
How do I access YouTube Studio Analytics on mobile?
Open the YouTube Studio app on iOS or Android, tap Analytics from the bottom navigation bar. You can view all core metrics — Views, Watch Time, CTR, Audience Retention, and Subscribers — from the mobile app. Advanced Mode is only available on desktop.
What is the YouTube Research tab and how do I use it?
The Research tab is inside YouTube Studio under Analytics. It shows search queries your audience uses on YouTube, highlights content gaps — topics with demand but few strong videos — and lets you track trends over time. Use it before finalizing any new video topic to validate that real search demand exists before you invest production time.
Turn Studio Data Into Weekly Wins With EvenDigit
Data alone does not grow a channel. Decisions do. At EvenDigit, we translate analytics into a clear action plan. With 12+ years of digital marketing experience, 1,200+ successful projects, and a team backed by Softude, we bring process and accountability to every channel we work on.
What we set up for you:
- Saved Advanced Mode views your team can reuse every week without rebuilding from scratch.
- A packaging system for titles and thumbnails built to lift CTR systematically over time.
- An edit list built from Audience Retention and Key Moments that improves Average View Duration on existing uploads.
- Playlists, Cards, and End Screens configured to increase session depth and Views Per Unique Viewer.
- A two-week improvement loop for each upload with clear rules for scaling what works.
- Optional YouTube Ads to amplify proven videos without wasting budget on unvalidated content.
What you can expect:
- Cleaner reports and faster decisions — no more drowning in numbers without a clear next step.
- Fewer wasted edits and more predictable performance gains across uploads.
- A channel that attracts the right viewers and consistently brings them back.
If you want measurable growth, there is a lot to track, measure, and manage inside YouTube Studio. Our experts know how to do it correctly — from reading Key Moments and Audience Retention to shaping titles, thumbnails, and session pathways that lift results week over week.
Connect with EvenDigit and let us build the right plan for your channel so it grows with intent and clarity.